
The PAM Academy · Module 6
Most privileged access management programmes are funded on fear and renewed on evidence. The business case gets signed after an incident or an audit finding, the platform goes in, accounts get onboarded, and then somebody in a finance review asks the only question that matters: what did we actually get for this? Teams that cannot answer it in numbers end up defending their budget with anecdotes.
The problem is rarely a shortage of data. A PAM platform generates enormous volumes of it: every check-out, every elevation, every session, every rotation, every failed request. The problem is that raw activity is not insight. Counting accounts onboarded tells you how busy the team has been. It does not tell you whether privileged risk has fallen, whether engineers can get work done faster, or whether the organisation would survive the next credential-based attack better than it survived the last one.
This module is about closing that gap. It covers the PAM KPIs worth tracking, how to assess maturity honestly rather than optimistically, how to build reporting that different audiences will actually read, and how to run a measurement cycle that produces improvement rather than paperwork.
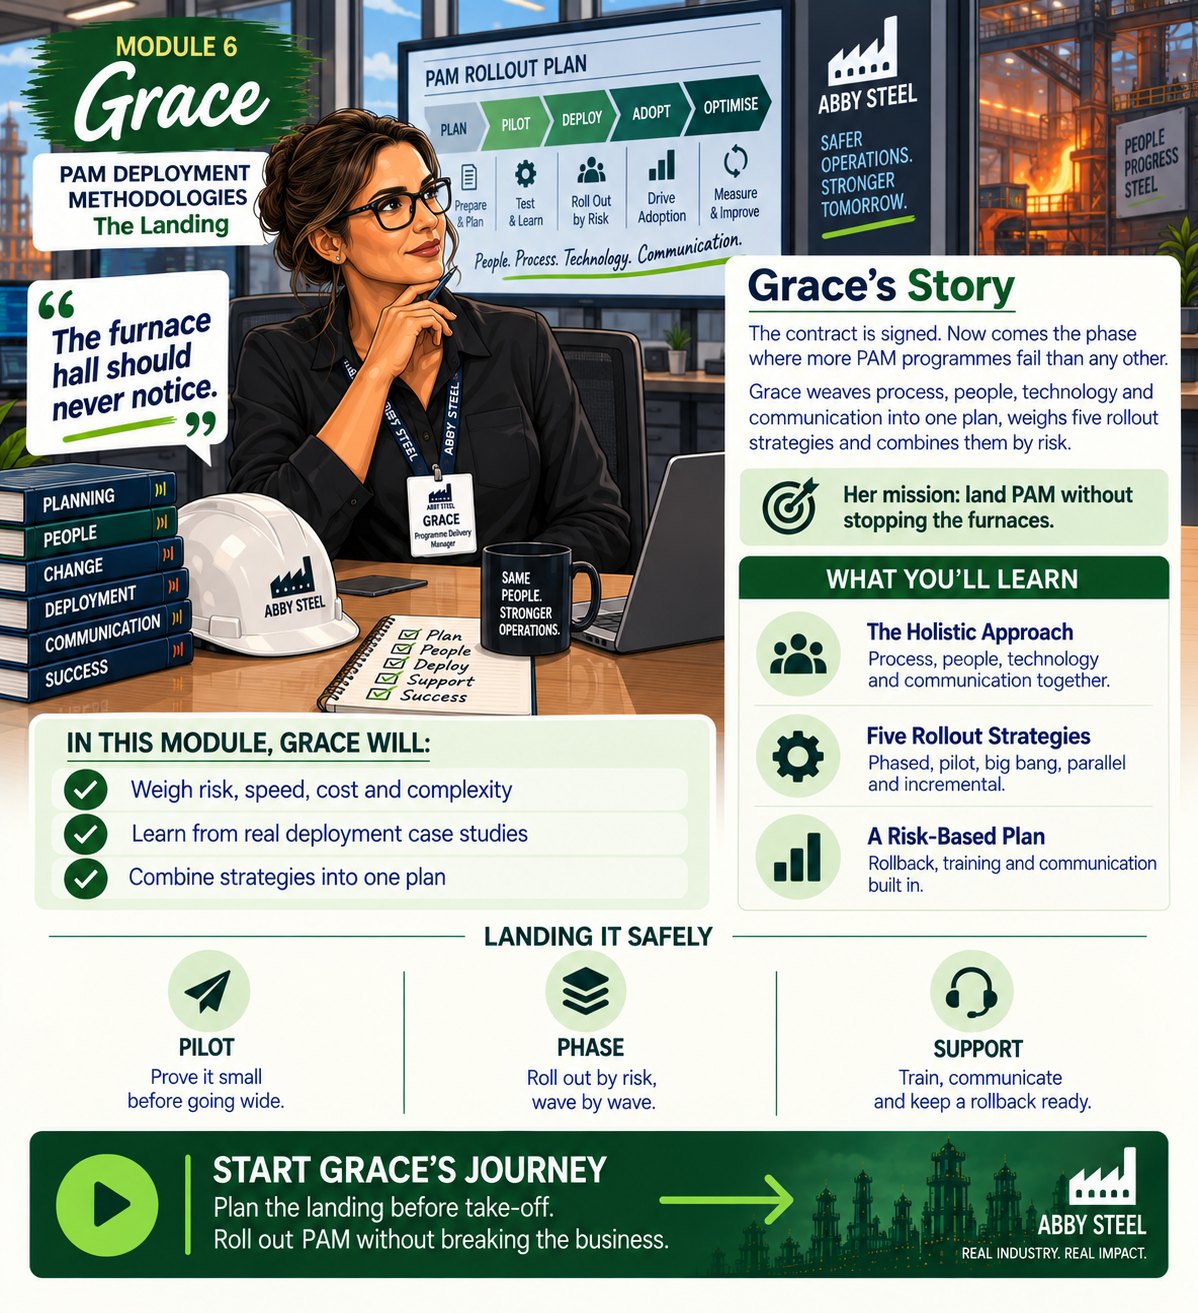
Module 6: Grace, Programme Delivery Manager
PAM Deployment Methodologies · “The Landing”. Grace lands the chosen PAM platform across Abby Steel without stopping the furnaces, choosing and combining rollout strategies by risk. Part of the PAM Academy, where every module follows one person through a real privileged access problem. Open Module 6 in the PAM Academy →
Who this module is for
CISO or Security Leader
A small, defensible set of executive metrics that translates privileged access coverage into risk and cost language a board will act on.
PAM Programme or Delivery Manager
A way to define success criteria before a wave starts, track delivery against them, and run a retrospective that changes the next wave.
IAM or PAM Engineer
Practical metric definitions with clear data sources, so dashboards reflect the platform’s real state instead of whatever was easiest to export.
GRC and Compliance Manager
Evidence structured for audit: coverage figures, exception ageing, break-glass usage and findings that carry a named owner and a date.
IT Operations or Service Desk Lead
Efficiency measures such as time to grant and time to revoke access, which show whether controls are helping or quietly creating workarounds.
The problems this module solves
Activity is reported instead of outcomes
Programme updates list accounts onboarded, sessions recorded and integrations completed. None of these say whether exposure has fallen. When the budget conversation arrives, the team has effort to show but no evidence of effect, and the programme becomes an easy target for cuts.
No baseline was ever captured
Measurement starts after the platform is live, so there is nothing to compare against. Improvements that genuinely happened cannot be proven, and problems introduced by the rollout cannot be separated from problems that were always there.
Maturity is self-assessed optimistically
Scores are set by the people who own the controls, using opinion rather than evidence. The assessment produces a comfortable number and no findings list, which means it produces no improvement either. Gaming a review only misleads the organisation running it.
One report is written for every audience
Engineers get a board summary with no detail, and executives get a screen of raw counters they cannot interpret. Neither group can make a decision from it, so reporting becomes a monthly ritual that changes nothing.
What you will learn
- The holistic approachApply the holistic approach, combining process, people, technology and communication, to a PAM deployment.
- Before the rolloutAssess the pre-rollout considerations, from risk appetite and demand for speed to cost, compliance and operational complexity.
- Five rollout strategiesCompare the five rollout strategies (phased, pilot, big bang, parallel and incremental) with their risks, advantages and disadvantages.
- Case-study lessonsDraw lessons from real case studies, including why the pace of the threat belongs in the rollout decision.
- A risk-based planCombine rollout strategies into a risk-based deployment plan with rollback, training and communication built in.
Why can’t most PAM programmes prove they are working?
Privileged access management sits in an awkward place. When it works, nothing happens, and nothing is difficult to report. That is why so many programmes fall back on activity reporting: accounts onboarded, sessions recorded, integrations delivered, waves completed. Those numbers describe effort. They say nothing about whether the organisation is harder to attack than it was last quarter.
The second reason is missing baselines. Teams start measuring once the platform is live, which means they cannot show a before and after. If the number of unmanaged administrator accounts was never counted at the start, a later count of a few hundred is impossible to interpret. It might be a triumph or a warning.
The third reason is that measurement is treated as a reporting task rather than a delivery control. Programmes that skip defined success criteria discover their problems in production. In 2017 a leading healthcare provider pushed a new PAM solution into every department at once with no staged learning loop. Help desks were overwhelmed, staff in radiology and emergency care were locked out of essential systems, treatment was delayed, and legacy compatibility problems surfaced that earlier testing had never found. Nobody had defined, in advance, what a healthy go-live looked like or what would trigger a stop.
Good measurement answers three questions, repeatedly and in that order. Are we reducing privileged risk? Are we making legitimate work faster rather than slower? Can we evidence both to somebody who was not in the room? A metric that does not serve one of those three questions is usually a metric you can drop.
Which PAM metrics and KPIs actually matter?
Useful PAM KPIs fall into four families. Pick a handful from each rather than tracking everything, because a scoreboard nobody reads is the same as no scoreboard.
Coverage and control. The percentage of discovered privileged accounts under vault management, weighted by asset criticality. The count of accounts found by discovery but still unmanaged. The percentage of privileged sessions recorded. The number of standing administrator accounts remaining, and how many have moved to just-in-time elevation. Credential rotation completed on schedule. Service accounts with a named human owner.
Operational efficiency. Mean time to grant approved privileged access. Time to revoke access on a leaver or role change, which is where most organisations quietly fail. The proportion of access granted through an automated workflow rather than a manual ticket. Privileged access tickets raised per month, and the share resolved without human intervention.
Risk and assurance. Open policy exceptions and their ageing. Break-glass account usage, and the percentage of those uses reviewed within the agreed window. Failed or denied privileged requests. Time to detect and respond to an anomaly in a privileged session. Audit findings open, closed, and overdue.
Adoption and business value. Users onboarded against plan for each wave. Training completion. User experience feedback from privileged users, since security that ignores how work actually happens gets worked around. Downtime attributable to PAM changes, which should trend towards zero.
Whatever you choose, define each KPI properly before it goes on a dashboard: a plain-language definition, the system of record it comes from, the reporting frequency, the owner, a target and the threshold at which somebody must act. Undefined metrics generate arguments about the number instead of decisions about the risk.
How do you assess PAM maturity?
A maturity model gives you a shared vocabulary for where the programme actually is, so investment conversations stop being about preference. A practical PAM maturity journey runs through five stages.
- Basic. Limited visibility and ad-hoc processes. Privileged accounts exist in unknown numbers and are managed by habit.
- Defined. Documented processes and standard practices. People know what is supposed to happen, even if execution varies.
- Managed. Consistent execution and effective controls. The process is followed reliably and exceptions are visible.
- Optimised. Measured performance and proactive improvements. Data drives changes before incidents force them.
- Transformed. Business outcomes driven by PAM. Access decisions support operational and commercial goals, not just compliance.
Assess against domains rather than as one overall guess. Typical domains include policy and process, asset and account discovery, access controls, monitoring and auditing, technology integration, DevOps and secrets handling, and break-glass procedures. Score each separately, because most organisations are uneven: strong on vaulting, weak on service accounts, weaker still on secrets in pipelines.
Two rules keep an assessment honest. First, score on evidence, not opinion. If you claim consistent execution, show the audit trail, the completed reviews and the exception log. Second, treat the review as a mirror rather than a trial. An assessment that produces no findings has failed, because there is always a findings list. What separates a mature organisation from an immature one is not the absence of gaps but the presence of correction: every gap logged, owned and dated.
Run a full assessment annually and a lighter check quarterly, and always keep the previous scores so movement is visible.
How do you report PAM metrics to the board?
Reporting fails when one document is written for everybody. Build three layers instead, each with its own audience, cadence and level of detail.
Operational, weekly, for engineers and the service desk. Queue depth, failed check-outs, rotation failures, integration health, tickets ageing. This layer is diagnostic and can be as detailed as the team needs.
Programme, monthly, for delivery leads and risk owners. Coverage against plan by wave and business unit, time to grant and revoke, exception ageing, open findings with owners and dates, and the decisions needed this month. This is where prioritisation happens.
Executive, quarterly, for the board and audit committee. One page. Five to eight measures, each shown as a trend rather than a single figure, each expressed in business terms. Boards are not asking how many accounts are vaulted; they are asking whether the organisation’s exposure to credential-based attack is falling, whether regulatory obligations are being met, whether the spend is producing a return, and what decision is being requested of them.
Some translations that work: coverage of privileged accounts on critical systems becomes the share of crown-jewel assets protected. Time to revoke becomes how quickly the organisation closes access when someone leaves. Break-glass usage with review completion becomes evidence that emergency access is controlled and inspected. Audit findings closed on time becomes assurance quality.
Use a status rating only if the thresholds behind it are written down, otherwise it becomes a matter of taste. Attach a named owner to every item and finish with an explicit ask: a decision, a resource, or an acceptance of residual risk. Reporting that carries no ask trains the board to skim it.
How do you benchmark PAM performance against peers and best practice?
Benchmarking has two forms, and the internal one is more useful than most teams expect. Start there.
Internal benchmarking compares like with like inside your own organisation: this wave against the last wave, this business unit against that one, this quarter against the same quarter last year. Because the definitions, data sources and context are identical, the comparison is trustworthy. It also surfaces uncomfortable and valuable questions, such as why one region revokes access in hours while another takes weeks with the same tooling and the same policy.
External benchmarking compares your position against industry frameworks, regulatory expectations, published maturity data and the experience of vendors or consultants who have implemented the same platform elsewhere. External support is worth most in the early stages and at transitions, when internal experience is thinnest. Treat external figures carefully: definitions vary, and a coverage percentage means nothing without knowing what was counted as a privileged account.
Benchmarks should set direction, not declare victory. Use them to answer questions such as whether your time to revoke is normal or poor for your sector, whether your maturity profile is unusually uneven, and where peers have already solved a problem you are still funding.
Include the pace of the threat in the comparison as well as the pace of the organisation. In 2017 WannaCry spread through outdated systems to more than two hundred thousand computers across one hundred and fifty countries, hitting the UK’s National Health Service hard enough to cancel appointments and operations. A gradual improvement plan can be perfectly reasonable and still leave you slower than the risk you are managing. Benchmarking is how you find out which one you are.
How do you turn PAM metrics into continuous improvement?
Measurement only pays off if it is wired into a cycle that produces change. The cycle has five steps and repeats on a published cadence.
- Baseline. Record the starting position before any change, including the counts that will embarrass you. Without this, no later improvement can be evidenced.
- Define success in advance. Write down what a good result looks like for each wave or quarter, including the thresholds that would trigger a pause or a rollback. Criteria agreed afterwards are opinions.
- Measure and review. Hold a retrospective after every wave and a formal review each quarter. Compare against the criteria, not against how the delivery felt.
- Convert findings into work. Each gap becomes a backlog item with an owner and a date. Items without both tend not to happen.
- Close the loop with users. Tell people what changed as a result of their feedback, or the feedback stops arriving.
Several practical mechanisms keep this alive. Ticketing systems and digital feedback channels capture user experience systematically rather than anecdotally. Workflow automation reduces human error, streamlines request and approval, guarantees timely revocation, and as a side effect produces cleaner telemetry than manual processes ever will. Learning management platforms keep training current for both administrators and end users, and completion rates become a metric in their own right. Standard operating procedures with real technical detail mean the system is managed consistently even as staff change, so institutional memory is written down rather than walking out with each leaver.
Go-live is the start line. The programme that keeps measuring is the one that keeps improving.
Grace’s story
Grace runs delivery for a global steelmaker with furnaces that never stop. Before a single privileged account moved, she wrote the success criteria for the pilot down and published them, so the two-week trial with the infrastructure and engineering teams could be judged rather than debated. The pilot group was chosen to be friendly but not tame, because success in easy conditions convinces nobody.
From there the programme ran in waves ordered by the risk ranking the security team had already produced: crown jewels first, then corporate IT, then the operational technology estate feature by feature, with the old system running alongside on furnace-hall systems and the rollback plan rehearsed like a fire drill. Every wave ended with a retrospective, and every retrospective produced changes to the next one. One engineer’s verdict on the new access route, that it was faster than his old workaround, became an informal benchmark for every screen that followed. Ninety days later the platform was live across the company. The furnaces never noticed, which was the measure that mattered most.
Common mistakes to avoid
Measuring what the tool exports rather than what the business needs
Dashboards get built from whichever reports ship in the box, so the programme optimises for convenient numbers. Decide what questions you need answered first, then work out which data source answers them.
Tracking coverage without tracking risk
Ninety per cent of accounts under management sounds strong until you learn the remaining ten per cent are the domain administrators. Weight coverage by asset criticality so the figure reflects exposure, not headcount.
Treating the maturity score as the deliverable
A score with no findings list changes nothing. The value of an assessment is the gaps it exposes and the owners and dates attached to them, not the number printed on the front page.
Reporting a single point instead of a trend
One month’s figure invites argument about whether it is good. A trend line over several months shows direction, which is what leaders actually decide on. Keep history from the first measurement onwards.
Stopping measurement when the project closes
Deployment is a start line, not a finish. Without standard operating procedures and a set review cadence, measurement dies with the project team and the programme quietly drifts back towards its old state.
Key takeaways
- Capture a baseline before you change anything, or you will never be able to prove what improved.
- A metric without an owner, a source, a frequency and a target is a number, not a KPI.
- Weight privileged account coverage by asset criticality so the figure reflects real exposure.
- Maturity assessment is a mirror, not a trial: the findings list is worth more than the score.
- Report in three layers, operational, programme and executive, and always attach a decision or an ask.
Frequently asked questions
What are the most important PAM KPIs to track?
Start with a small set spread across three areas. For security coverage, track the percentage of discovered privileged accounts under management weighted by asset criticality, the number of standing administrator accounts remaining, and the percentage of privileged sessions recorded. For efficiency, track mean time to grant approved access and time to revoke access on a leaver or role change. For assurance, track open policy exceptions with their ageing, break-glass usage and the share of those uses reviewed on time. Five to eight measures reported as trends will influence more decisions than fifty reported once.
What is a PAM maturity model?
A PAM maturity model describes the stages a privileged access programme passes through, so you can place your organisation objectively and plan the next step. A common progression runs from basic, meaning limited visibility and ad-hoc processes, to defined, with documented processes and standard practices, to managed, with consistent execution and effective controls, to optimised, where performance is measured and improvements are proactive, and finally to transformed, where business outcomes are driven by PAM. Score individual domains such as discovery, access controls, monitoring and break-glass separately, because most organisations are stronger in some areas than others.
How do I measure the return on investment of a PAM programme?
Build the case from three streams rather than one. Risk reduction: show the fall in standing privileged accounts, unmanaged accounts on critical systems, and the time taken to revoke access, since these are the conditions attackers exploit. Operational saving: measure time spent on manual password resets, access requests and approvals before and after automation, then convert it into staff hours. Assurance and compliance: count audit findings avoided or closed early and the effort saved in evidence gathering. Present all three as trends against your baseline, and be explicit about which figures are measured and which are estimated.
How often should we run a PAM maturity assessment?
A full evidence-based assessment once a year works for most organisations, with a lighter quarterly check on the domains that are moving or are known to be weak. Reassess sooner after any material change: an acquisition, a major platform migration, a significant reorganisation, or an incident involving privileged credentials. Keep every previous score so movement is visible over time, and keep the findings list alive between assessments. The point is not the annual number. It is whether last year’s gaps were closed by owners on dates, and whether new ones are being found and logged.
What security metrics should we present to the board?
Boards need a short page that answers four questions: is our exposure falling, are we meeting our obligations, is the spend producing a return, and what do you need from us. Translate technical measures into those terms. Coverage of privileged accounts on critical systems becomes the share of crown-jewel assets protected. Time to revoke becomes how quickly access closes when someone leaves. Break-glass usage with completed reviews becomes evidence that emergency access is controlled. Show trends rather than single figures, name an owner for every item, and finish with an explicit decision or resource request.
Start Module 6 in the PAM Portal
Work through Grace’s module in full, with the walkthroughs, templates and assessment that turn this into something you can apply on Monday morning.
Open Module 6 in the PAM Portal
Vendor-neutral. Built by practitioners. Designed around the roles that do the work.